Merkle, a global performance marketing agency, recently released its quarterly Digital Marketing Report detailing its findings in paid search, organic search and social, display and paid social, Amazon ads, and comparison shopping engines. Rather than tackle all those categories, this post will focus on the report’s paid social data. It includes data from Facebook, Instagram and YouTube.
This is interesting – the cost to advertise on Facebook in Q2 has grown 70% YoY. This has caused the overall spend on Facebook during Q2 to increase 40% versus the year prior. However, while spending and costs are up, overall impressions on Facebook (not including Instagram) were down 17% YoY.
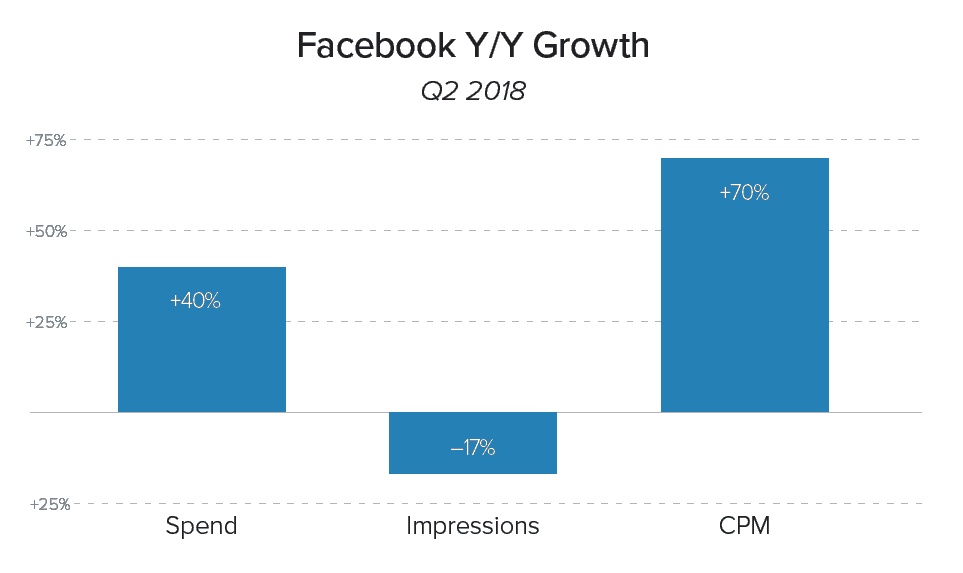
How could this be? Marketers are spending more money and getting less than what they were getting in Q2 2017. Paid Facebook advertising is a marketplace. The more demand it has for inventory the costlier it will be to purchase. Without more data it’s hard to say whether or not this is 100% responsible for the reduced impressions and increased costs or not. Algorithm and targeting changes on the paid side could impact this as well.
The increase in Facebook ad spending on Instagram Q2 YoY is far outpacing that of Facebook, up 177%. That’s really not that surprising considering Instagram’s adoption rate continues to grow, and video was just recently introduced to the platform. Video probably has a lot to do with the large growth (209%) in impressions. Last year, time spent watching video on Instagram was up more than 80% YoY.
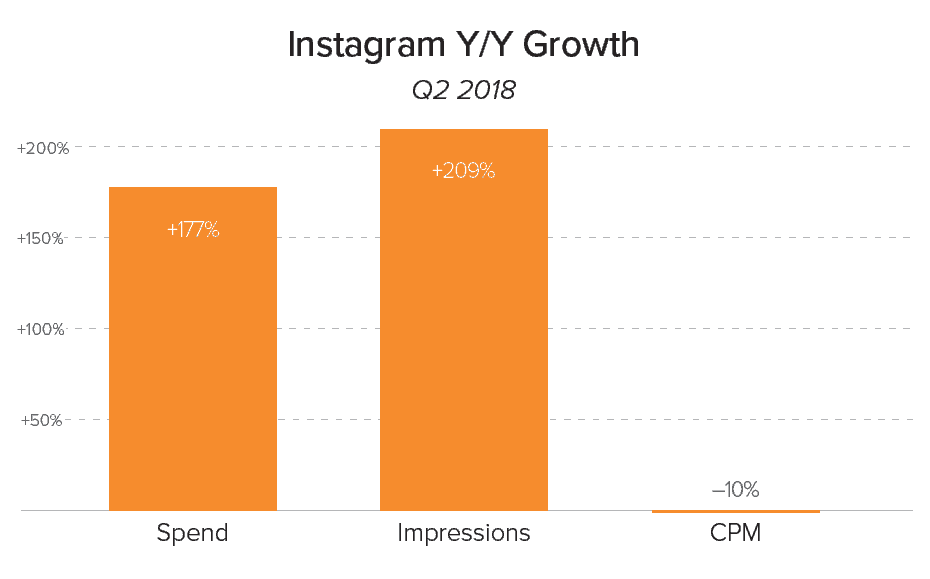
Even with all of this growth, somehow advertising on Instagram was modestly cheaper in Q2 2018 vs. Q2 2017. Overall, the large swings up for ad spending and impressions isn’t very surprising. It only took two years for Instagram to more than double its user base. In addition, as of last year the platform boasted that 70.7% of all US businesses were using it. As long as Instagram is still in growth mode, we’ll likely continue to see upward swings in spend and impressions YoY until that growth begins to lessen.
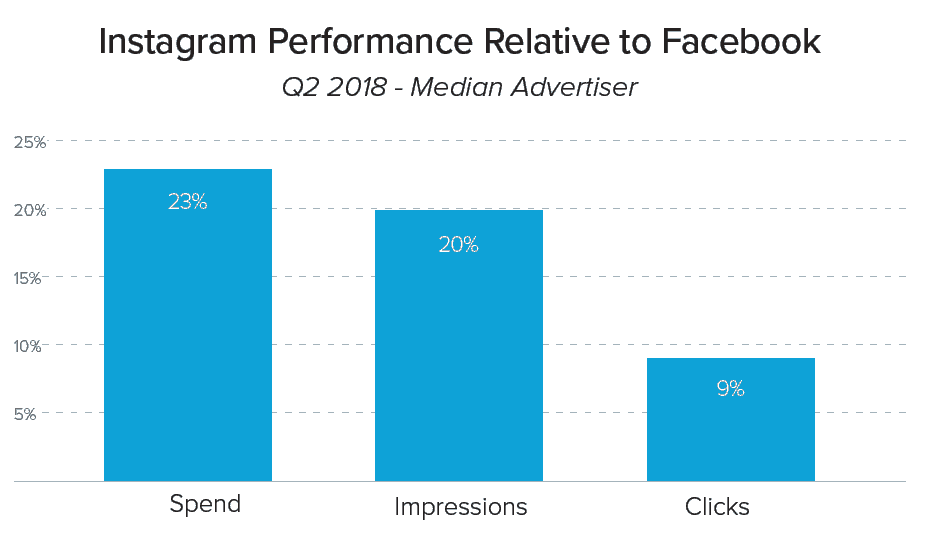
When looking at spend, impressions and clicks for both Facebook and Instagram combined for the median advertiser we see Instagram represented 23% of all spend in Q2. Since Facebook is the largest and most popular paid social network with an interface that allows for ad management on both platforms, this growth isn’t surprising. In Q1 Instagram only accounted for 9% of total ad spend for the median advertiser actively bidding on both.
It’s long been said that content is king. In Facebook’s case, mobile content is clearly king. Q2 YoY growth in both ad spend and clicks is up and to the right. This really isn’t much of a surprise, either. However, there’s a good chance we’re approaching a plateau in the not-so-distant future.
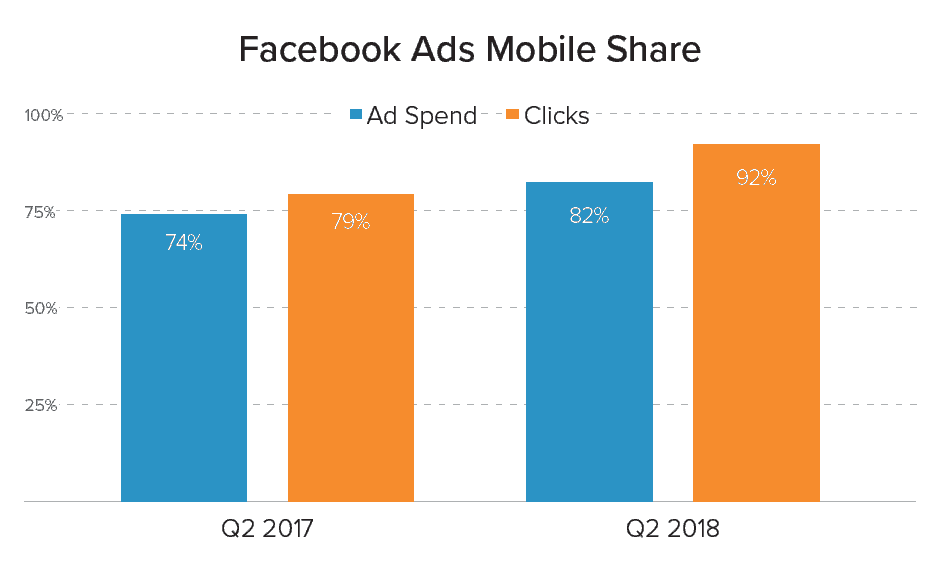
In January of 2018 Facebook announced some sweeping changes to its news feed algorithm. In a nutshell, they pushed “public” content (content from publishers and businesses) off most newsfeeds in favor of content from family and friends. It’s likely this was also a move to get more news feed ad units showing. The end result? More news feed ad click-throughs.
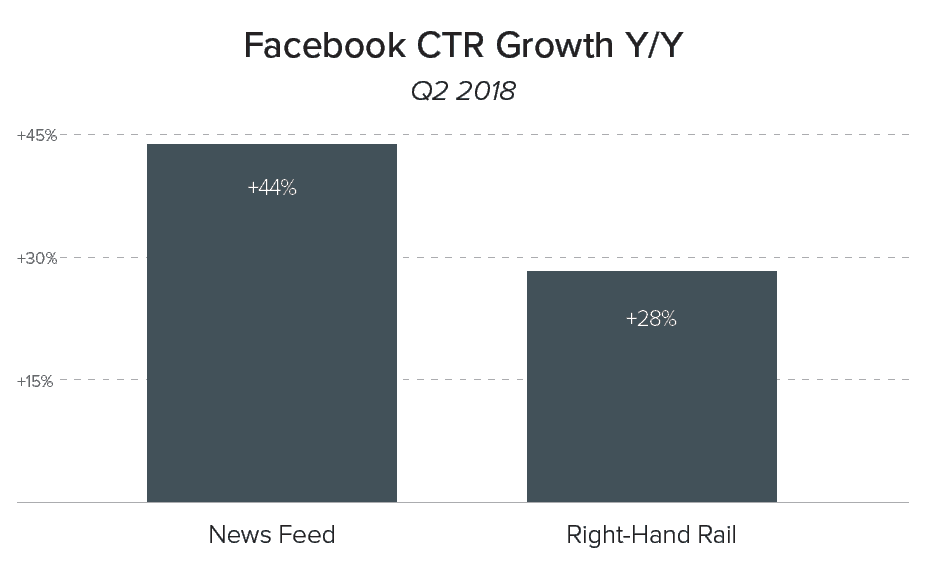
That said, it still doesn’t explain the growth in CTR on right-hand rail units. As I understand it, these units are for the desktop environment and not mobile. Just speculating here, but the growth in CTR could be a result of the shrinking Facebook population on desktop. It’s possible that as more users abandon the desktop for mobile the group that’s left are more likely to click on a right-hand rail unit.
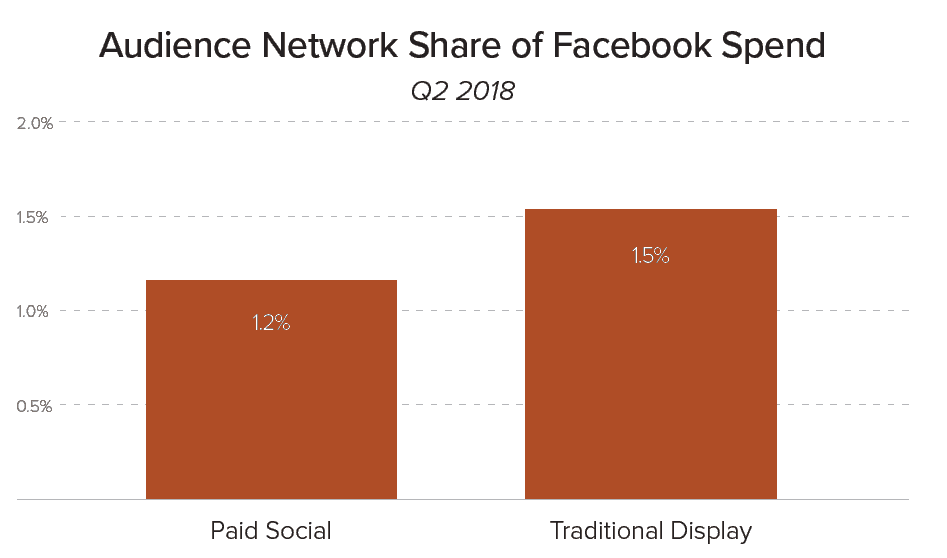
Facebook’s Audience Network represents a way for advertisers to extend their reach past Facebook and Instagram. The numbers below exclude Instagram, however. That said, the Facebook Audience Network only accounted for 1.5% of Facebook ad spending in Q2 2018.
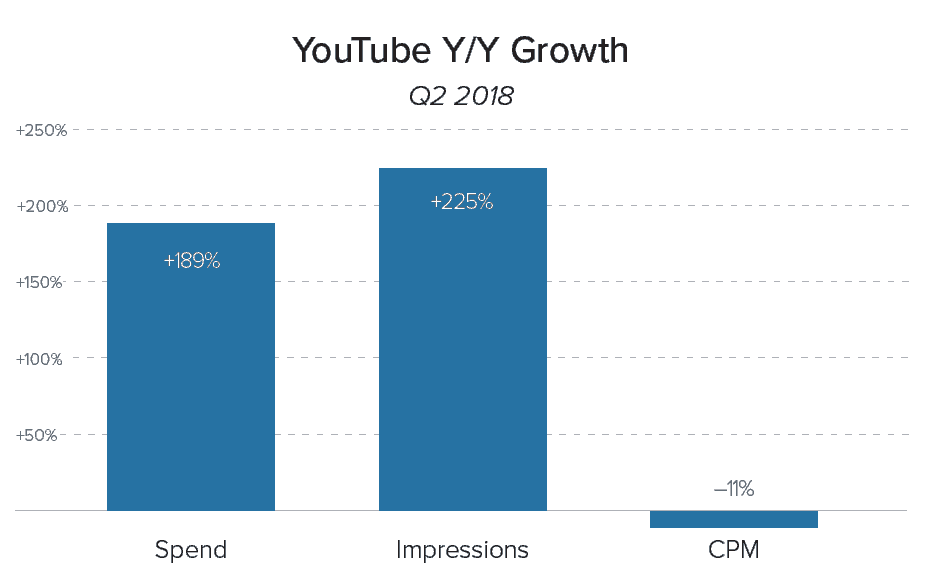
YouTube has shown considerable growth in the number of ad impressions in Q2 this year versus last. This growth also helped to drive up ad spend. A modest decline in the cost of impressions were realized, too. Not sure exactly why there’s such a flurry of new incremental ad spend on YouTube. That said, however, it’s growing users nearly twice as fast a Facebook. That may have something to do with it.
What do all these numbers mean in the overall paid social media arena? Generally speaking, it reinforces what we already knew, advertising on social media is still in growth mode and shows no sign of slowing down soon. Facebook’s decrease in impressions was the biggest surprise. However, it’s just one quarter’s data and could do a one-eighty next time we look at these numbers. Until there’s a clear pattern it’s hard to come to any sweeping conclusions. That said, keep an eye on this stat.
This article originally appeared on inPowered's Content Amplification blog.