
Early in my career I promised a client I could tell them exactly which pages, channels, and messages were driving revenue. I was half-guessing and they could tell.
That embarrassment sent me deep into every analytics platform I could get my hands on. What I found was that most of them looked great in a demo and fell apart in the real work — bad sampling, murky attribution, setup headaches that ate weeks I didn’t have.
What changed things was watching how the sharpest operators I knew actually worked. They weren’t obsessing over dashboards. They had clean data, clear questions, and enough discipline to act on what they found without second-guessing everything.
I run SEO and AI visibility campaigns for brands at Relevance, which means I’m in analytics tools every single day — not to admire them, but to find what’s working and fix what isn’t before a client asks.
I don’t think you need the fanciest stack to do that well. If you get a platform that fits where your team actually is — in terms of skills, budget, and the questions you’re trying to answer right now, you are going to do just fine.
This guide covers the platforms I genuinely rely on in client work. I don’t do any sponsored picks, so don’t ask.
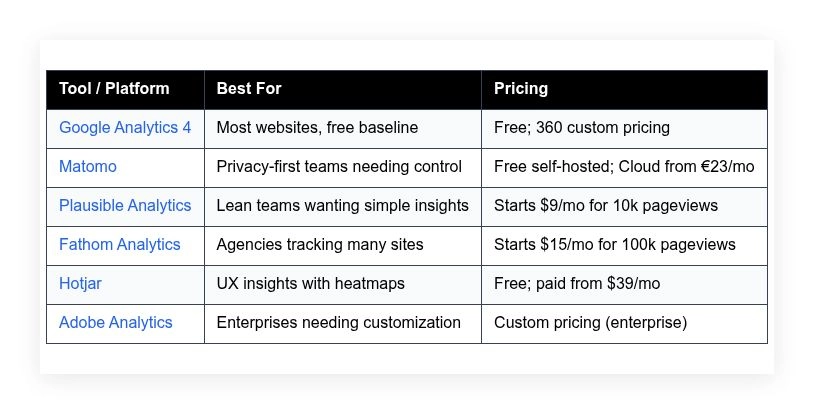
Quick comparison table is below if you want to skip ahead. Otherwise keep reading for the full breakdown.
My picks for marketing analytics platforms for 2026
Scroll down for my hands-on take on each tool, which one I personally picked, and the best free options if you’re just starting.
What is a marketing analytics platform?
A marketing analytics platform is software that collects, organizes, and reports customer and campaign data so you can see what drives traffic, conversions, and revenue.
In growth work we say, “You can’t improve what you don’t measure.” These tools give you direct visibility into user behavior, so you make decisions with data you own.
Think of it like this: a single percentage point lift in conversion can beat a big ad spend increase. Improving 2.5% to 3.5% converts 40% more leads from the same traffic.
At their core, these platforms help marketers, analysts, and founders track events and sessions from sites, apps, and campaigns, then tie actions to outcomes for clear decisions.
People often pair analytics with A/B testing, session replay, CDPs, and BI tools for deeper reporting and activation across email, ads, and CRM systems.
Not every option is equal though, so you’ll want to pick carefully based on your goals, privacy needs, and resources.
How to choose the best marketing analytics platform
There are tons of options, so picking one can feel overwhelming. The right answer depends on your traffic, stack, compliance needs, and who will use the data.
I wrote this to help you find a tool that fits your stage, not someone else’s. The picks here come from real client work under real deadlines.
Most guides are written by the companies selling the software or by media sites with paid placements. I am not sponsored by any platform on this list. This is straight, experience-based advice that I’m confident handing to a friend.
Here are some questions you should ask when looking for a platform:
- How generous is the free tier, and what are the limits?
- Can I do core tasks fast—tagging, events, goals, and funnels?
- Will it scale with traffic, sites, and teams as we grow?
- What’s the real cost as volume and features increase?
- Does it have the features I need—attribution, cohorts, API access?
- Are the reports accurate, unsampled, and easy to QA?
- How hard is migration if I switch later?
- What uptime, retention, and privacy controls exist?
- Any technical constraints—cookies, consent mode, or self-hosting?
It’s a lot. The ranked list below reflects those questions, plus what actually moved KPIs for clients.
Okay, enough of me rambling, let’s get into the list.
6 best marketing analytics platforms in 2026
Here are my top picks for the best marketing analytics platforms:
- Google Analytics 4
- Matomo
- Plausible Analytics
- Fathom Analytics
- Hotjar
- Adobe Analytics
Let’s see which one is right for you.
1. Google Analytics 4

GA4 is Google’s free, event-based web and app analytics platform designed for general marketing teams. It replaced Universal Analytics and now centers everything on events and parameters. It’s maintained by Google’s long-standing analytics group and integrates tightly with Google Ads and BigQuery.
You can start for free. Setup is quick with the GA4 tag or Google Tag Manager. The main experience is the Reports workspace plus the Explore interface for funnels, paths, and segments. Daily tasks include checking acquisition, conversion events, and pages/screens performance.
Recent improvements include consent mode upgrades, better channel groupings, and cleaner attribution settings. The BigQuery export is now standard in free GA4, which opens advanced modeling and unsampled analysis without paying for 360.
On higher tiers (Analytics 360), larger quotas, roll-up properties, and SLA-backed support come into play. Enterprises also get more subproperties and custom dimensions, which helps multi-brand teams stay organized.
I use GA4 on most sites as a baseline. It’s the fastest way to align teams on traffic, conversions, and trends, then decide where to dig deeper with other tools.
One small but welcome detail: GA4’s DebugView and real-time reports are helpful for QA, especially when shipping tags under tight timelines.
How it works and key features
GA4’s interface mixes standard reports with an “Explore” builder for free-form tables, funnels, and pathing. You can customize collections, add comparisons, and save audience segments. Templates cover lifecycle views, engagement, monetization, and retention.
Advanced users rely on Google Tag Manager for custom events and parameters, then verify with DebugView. BigQuery export enables SQL-level analysis and connections to Looker Studio or other BI tools. Attribution reports compare data-driven, last-click, and position-based models.
Automations include audiences for remarketing, conversion tracking synced to Google Ads, and predictive metrics for purchase probability on some properties. GA4 also supports cross-domain tracking, user-ID, and consent mode for privacy setups.
Support comes from Google’s docs, community forums, and many third-party experts. As one client told me, “We finally got a single source of truth for campaigns once we cleaned up our events.” — Growth Lead, B2B SaaS
Overall, it’s beginner-friendly for basics and powerful for advanced teams when paired with Tag Manager and BigQuery.
Who it’s for
Best for marketers, content teams, ecommerce, startups, and agencies needing a free standard. Great for tracking site content, lead flows, and ad performance. Strong for teams using Google Ads or BigQuery. If you need full data control or no-cookie tracking, privacy-first tools may suit you better. Technical skill is helpful but not required for basics.
Google Analytics 4 pricing
GA4 uses a freemium model. The standard product is free with generous features, while Analytics 360 adds higher limits and enterprise support. There’s no time-limited trial; you can implement and keep using the free tier indefinitely.
- GA4 Standard: $0/month, includes core reporting, Explore, BigQuery export, and Google Ads integrations
- Analytics 360: Custom annual pricing via sales, higher quotas, roll-up properties, SLA, and enterprise governance features
For most small to mid sites, the free tier is enough. Larger organizations with many properties, higher hit volumes, or compliance needs should look at 360. Annual contracts apply for 360 and are negotiated via partners.
Pros and cons
- Pros: Free core product; strong Google Ads and BigQuery ties; flexible event model; wide ecosystem and training.
- Pros: Explore workspace enables deep funnels and pathing without extra cost.
- Pros: Real-time and DebugView simplify QA.
- Cons: Learning curve from Universal Analytics; sampling and limits can frustrate heavy users.
- Cons: Privacy controls depend on proper consent mode setup.
- Cons: Attribution differences vs ad platforms require education.
If you want a free, widely adopted baseline, pick GA4. If you need full control or cookie-free tracking out of the box, consider Matomo or Plausible.
Google Analytics 4 reviews
G2: strong 4+ average rating (large sample). Capterra: 4+ average rating. Ratings and counts change often; feedback highlights rich features and a learning curve.
2. Matomo
Matomo is a privacy-focused web analytics platform with self-hosted and cloud options. It originated from the Piwik project and has been active for years with a strong open-source community. Many organizations choose Matomo to keep full ownership of data.
You can start free by self-hosting, or use Matomo Cloud with a guided setup. The interface feels familiar to users coming from traditional analytics, with clear reports for traffic, goals, and ecommerce. Day to day, I check channels, conversions, and behavior flow.
Recent updates have focused on performance, consent tools, and integrations. The platform keeps improving its Tag Manager and cookieless tracking modes, which helps teams adapt to tighter privacy rules.
Premium features include roll-up reporting, funnels, form analytics, and media analytics. These are handy for advanced CRO work without adding multiple vendors.
I use Matomo when clients have strict data residency or compliance needs. It’s a reliable way to keep analytics in-house without losing key reports.
Support materials are solid. I appreciate their clear consent documentation and deployment guides for popular stacks.
How it works and key features
Matomo’s interface offers standard dashboards, goals, segments, and ecommerce reports. You can customize dashboards, define events, and tag via Matomo Tag Manager. Templates help with common goals and funnels, and you can embed tracking across sites easily.
Advanced users can self-host with full control over data retention and backups. The platform supports APIs, custom dimensions, and integrations with CMSs and ecommerce systems. Reporting covers channels, pages, conversions, form analytics, and media tracking.
Automations include scheduled reports and alerts. Beyond core analytics, Matomo provides heatmaps, session recordings, and A/B testing as add-ons, which reduces tool sprawl. Support includes documentation, community help, and paid support for cloud.
Overall, it’s balanced: approachable for teams used to classic analytics and flexible for technical admins who need control.
Who it’s for
Ideal for compliance-heavy industries, EU-focused orgs, universities, public sector, and teams that want ownership. Great for cookieless or consent-driven setups and for companies standardizing on open-source. If you need deep ad network ties like Google Ads auto-imports, GA4 may be simpler. Technical skill helps for self-hosting.
Matomo pricing
Matomo offers self-hosted for free and a hosted cloud plan with tiered pricing based on traffic volume. Paid add-ons extend features like funnels and media analytics.
- Self-Hosted: $0/month, full data control, install on your server
- Cloud: From €23/month, ~50k hits/month, includes hosting, updates, and support
- Premium Add-ons: Priced per feature, include funnels, form analytics, media analytics
Compared to enterprise tools, Matomo is cost-effective, especially self-hosted. Cloud tiers scale with traffic. Annual billing discounts are available on cloud. For large sites, forecast storage and maintenance if self-hosting.
Pros and cons
- Pros: Full data ownership; self-host or cloud; strong privacy controls.
- Pros: Add-ons cover funnels, heatmaps, and A/B testing in one stack.
- Pros: Familiar UI for teams used to classic analytics.
- Cons: Self-hosting requires ops time; cloud cost scales with hits.
- Cons: Fewer native ad integrations than GA4.
- Cons: UI feels heavier than Plausible/Fathom for quick checks.
Pick Matomo if privacy and control are top priorities. If you want ultra-simple dashboards with minimal setup, Plausible could be faster.
Matomo reviews
G2 and Capterra show positive ratings from privacy-focused users. Public review counts are modest compared to GA4 but consistent.
3. Plausible Analytics
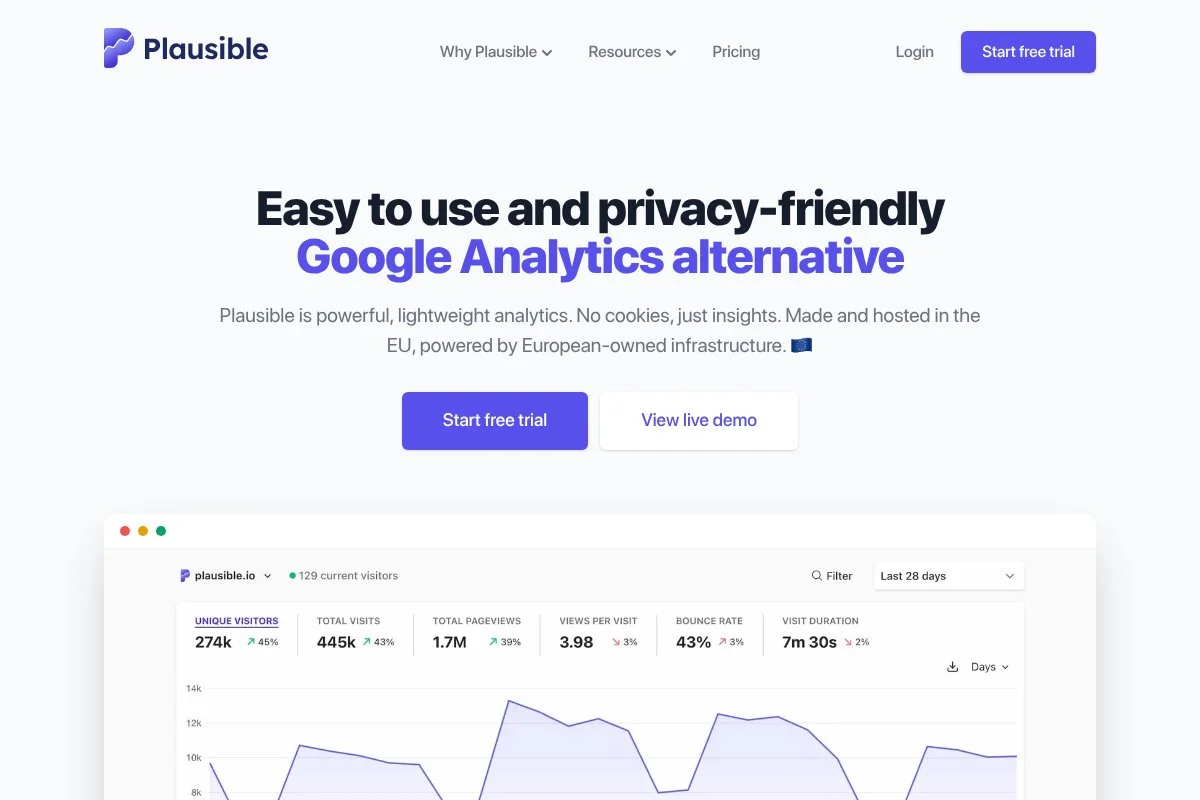
Plausible is a lightweight, privacy-friendly web analytics tool focused on clarity and speed. It’s run by a small, transparent team and is popular with developers, startups, and content sites that want fast answers without cookies.
You can try it quickly with a short script and a clean onboarding flow. The dashboard is simple by design: top pages, sources, goals, and campaigns all load fast. I use it for content-led sites where quick decisions matter more than deep exploration.
Recent improvements include better custom events, enhanced UTM handling, and features for tracking 404s and outbound links. The API and integrations continue to improve, making it easier to pipe data elsewhere.
Advanced options cover custom domains for the script, server-side tracking, and shared dashboards. You can also track multiple sites under one account, which is convenient for agencies.
I’ve recommended Plausible for teams frustrated with heavy UIs. It gets you to “what changed” in seconds, which is underrated in fast-moving content ops.
I also like their public roadmap and thoughtful blog posts about measurement choices. It builds trust.
How it works and key features
Plausible’s interface is minimal and fast. You get a single-page dashboard with collapsible sections for sources, pages, devices, geography, events, and campaigns. Custom goals are easy to define, and everything updates in near real time.
You can customize event tracking, add custom dimensions via props, and use the API to pull data into dashboards. Privacy features include no cookies by default and GDPR-friendly defaults. Reporting covers bounce rate, visit duration, and goal conversions.
Automations include email reports and alerts. Additional tools cover shared links, custom domains, and multi-site management. Support is via docs and email, with an active community of users sharing tips.
As one content lead told me, “Our writers actually check analytics now because it’s so clear.” — Head of Content, Media Startup. For most teams, it strikes a great balance of simplicity and enough depth.
Who it’s for
Great for content teams, indie devs, agencies, and startups who want straightforward insights and fast load times. Excellent for GDPR-minded organizations that prefer cookieless tracking. If you need complex funnels, cohorting, or ad platform ties, GA4 or enterprise tools fit better. No deep technical skill required for basics.
Plausible Analytics pricing
Plausible uses transparent, usage-based pricing by monthly pageviews, with all features included. There’s a free trial and discounts for annual billing and nonprofits.
- Starter: $9/month, up to 10k monthly pageviews, includes unlimited sites, events, and shared dashboards
- Growth tiers: Scaled pricing as pageviews increase; all features included
- Self-Hosted: Open-source option available for teams that want to run it themselves
Value is strong for lean teams. You don’t pay per seat, and the feature set stays the same as you scale. Annual billing lowers the price further. For very high traffic, forecast costs vs. Fathom or Matomo self-hosted.
Pros and cons
- Pros: Extremely fast, clear dashboard; privacy-first defaults.
- Pros: Simple pricing with unlimited sites and events.
- Pros: Lightweight script with minimal performance impact.
- Cons: Limited deep analysis features compared to GA4 or Adobe.
- Cons: No built-in heatmaps or session replay.
- Cons: Event modeling requires planning for advanced use.
If you want fast, trustworthy numbers without bloat, Plausible is hard to beat. If you live in funnels and cohorts, look higher on this list.
Plausible Analytics reviews
Product Hunt and G2 show favorable feedback, but public review counts are smaller than mainstream tools. Users praise speed and privacy stance.
4. Fathom Analytics
Fathom is a privacy-focused analytics tool known for simplicity and generous multi-site support. The company is independent and vocal about performance, privacy, and clear pricing.
Setup takes minutes. The dashboard shows top content, referrers, goals, and events. I like it for agencies because one plan can cover many sites without micromanaging seats.
Recent updates improved uptime and EU isolation options, plus quality-of-life changes to events and goals. Their status transparency and engineering posts inspire confidence.
Advanced features include custom domains, email reports, uptime monitoring add-ons, and server-side options. It’s not a deep product analytics tool, but it nails operational reporting.
I’ve used Fathom on content portfolios and microsite campaigns. It reduces overhead and still gives clear answers on what’s working.
Their support is responsive and friendly. The documentation is straightforward, which helps non-technical teammates jump in.
How it works and key features
Fathom’s interface is minimalist. You get a clean dashboard with filters for pages, referrers, UTM campaigns, devices, and countries. Event and goal setup is simple, and reports load fast even on large sites.
You can customize tracking with a custom domain to reduce ad-blocking. It supports multiple sites on one plan, and the script is optimized for speed. Reporting focuses on essentials: unique views, bounce rate, time on site, and conversions.
Automation features include scheduled emails and site-level alerts. There’s an API for exporting data to other systems. Support is handled via email and docs, with a focus on clarity.
Overall, it’s beginner-friendly and efficient for managers who need quick readouts across many properties.
Who it’s for
Perfect for agencies, publishers, creators, nonprofits, and SMBs managing many sites. Strong for privacy policies that prefer cookieless setups. If you need deep funnel or cohort analysis, GA4 or Adobe fit better. No special technical skills required for core use.
Fathom Analytics pricing
Fathom uses simple, usage-based pricing by monthly pageviews, and includes unlimited sites and team members on plans. Pricing is public and straightforward.
- Starter: $15/month, up to 100k pageviews, includes unlimited sites and email reports
- Higher tiers: Increase with traffic; all include unlimited sites and events
- Annual Billing: Discount available vs. monthly
For agencies, the unlimited-sites approach is great value. If you run one very large site, compare costs against Plausible tiers or Matomo self-hosted.
Pros and cons
- Pros: Simple, fast dashboard; unlimited sites; privacy-first.
- Pros: Custom domain tracking to reduce blocking.
- Pros: Clear, predictable pricing.
- Cons: Less depth for funnels and cohorts.
- Cons: Fewer native integrations than GA4.
- Cons: Limited BI/warehouse features.
If you manage many sites and want low overhead, Fathom is a strong pick. If you need enterprise analysis, look to Adobe or GA4 with BigQuery.
Fathom Analytics reviews
Public reviews on G2/Product Hunt are positive but limited in volume. Users highlight simplicity, speed, and responsive support.
5. Hotjar
Hotjar is a behavior analytics suite focused on heatmaps, session recordings, and on-site feedback. It’s been around for years and is widely used by UX and CRO teams to find friction points and test ideas.
You can start free and add the script in minutes. The core experience is reviewing heatmaps, filtering recordings, and running surveys or feedback widgets. I use it to validate hypotheses from GA4 by watching real sessions.
Recent updates improved performance, privacy controls, and integrations with popular A/B testing and analytics tools. Their Highlights feature helps teams share key moments from recordings faster.
Premium tiers add more daily session capture, advanced filters, and expanded feedback tools. For CRO programs, those filters and team collaboration features are worth it.
I lean on Hotjar to prioritize fixes. Numbers tell me what changed; Hotjar shows me why users struggled.
Their help center and onboarding tours make setup easy for non-analysts, which is great for cross-functional teams.
How it works and key features
Hotjar’s interface organizes heatmaps, recordings, and feedback tools in clear tabs. You can build segments, filter by device or behavior, and tag important sessions. Surveys and feedback widgets run directly on your site.
Templates help you launch surveys quickly. Technical users can leverage events and integrations to sync with analytics or testing tools. Reports summarize clicks, scroll depth, and rage/ujets to highlight issues.
Automations include sampling rules, triggers, and scheduled reports. You also get highlights and team notes for collaboration. Support includes docs, chat options on paid plans, and plenty of how-to guides.
Overall, it pairs well with a primary analytics tool to explain behavior and inform experiments.
Who it’s for
Best for CRO specialists, UX designers, product marketers, and founders running experiments. Great for diagnosing drop-offs, validating page changes, and collecting on-site feedback. If you only need traffic counts and goals, it’s overkill. No deep technical skill required.
Hotjar pricing
Hotjar uses tiered pricing across products (Observe, Ask, Engage). There’s a free plan and paid tiers that scale by sessions and features.
- Basic (Free): $0/month, limited daily sessions, heatmaps, and recordings
- Plus: From $39/month, more daily sessions, basic filters, and surveys
- Business: From $99/month, advanced filters, events, and team collaboration
- Scale: Higher limits and advanced controls for larger teams
Value is strong if you use recordings and feedback weekly. Costs scale with session volume. Annual billing reduces price. I suggest starting on Plus, then leveling up as experiments increase.
Pros and cons
- Pros: Heatmaps and recordings explain the “why.”
- Pros: Quick setup; good templates for surveys.
- Pros: Strong collaboration and sharing features.
- Cons: Costs rise with traffic; sampling may be needed.
- Cons: Not a replacement for core analytics.
- Cons: Requires discipline to tag and review sessions.
Use Hotjar alongside GA4 or Matomo to validate insights. If you never watch recordings, you won’t get the value.
Hotjar reviews
G2 and Capterra both show strong 4+ average ratings across many reviews. Common praise: setup speed and clarity of insights.
6. Adobe Analytics

Adobe Analytics is an enterprise analytics platform built for customizable reporting at scale. It’s part of Adobe Experience Cloud and has a long track record with large global brands and complex data needs.
There’s no free plan, and onboarding is guided. The Analysis Workspace is the heart of the product, letting you drag and drop dimensions, metrics, and segments into powerful reports. Daily power users build custom views, funnels, and breakdowns.
Recent focus areas include tighter integration with Adobe Real-Time CDP and Journey Optimizer, plus better governance and privacy controls. That unlocks advanced activation on top of analytics.
Premium capabilities include virtual report suites, robust attribution, predictive features, and deep user permissions. Few competitors offer this level of workspace customization.
I’ve used Adobe Analytics on multi-brand, multi-region stacks. It shines when you need consistent definitions across teams and deep segmentation.
Enterprise support, training, and partner networks are extensive. Once teams learn the Workspace, analysis speed improves dramatically.
How it works and key features
Analysis Workspace is a flexible canvas with panels for freeform tables, visuals, and cohort or fallout analysis. You can create segments on the fly, trend them, and share projects across teams with permissions.
Templates and calculated metrics help standardize reporting. Technical teams can implement via Adobe Launch, server-side, or tag managers. Integrations with Experience Platform support identity stitching and activation.
Reporting covers granular pathing, attribution, cohorts, and product performance. Automation includes scheduled reports, alerts, and API exports to data warehouses. Enterprise support and training resources are deep.
Overall, it’s powerful for advanced users and large organizations with the resources to implement and govern it well.
Who it’s for
Best for enterprises, multi-brand retailers, banks, media companies, and any org with complex governance. Excels at deep segmentation, custom metrics, and standardizing analytics across regions. If you’re a small team or budget-limited, GA4, Matomo, or Plausible are more practical. Technical expertise is expected.
Adobe Analytics pricing
Adobe Analytics uses custom, enterprise pricing based on volume, features, and bundling with other Adobe Experience Cloud products. There’s no public free tier.
- Select/Prime/Ultimate: Custom pricing, includes Analysis Workspace, advanced segmentation, governance, and enterprise support
- Add-ons: Priced by features and data volume across the Adobe Experience stack
Compared to other tools, Adobe is a premium option. Value is high for organizations that will fully use custom metrics, governance, and integrations. Expect annual contracts and implementation costs through partners.
Pros and cons
- Pros: Extremely flexible Workspace; enterprise governance and permissions.
- Pros: Strong integrations with Adobe Experience Platform.
- Pros: Powerful segmentation and calculated metrics.
- Cons: Expensive; requires expert implementation and maintenance.
- Cons: Steeper learning curve than most tools.
- Cons: Overkill for smaller teams.
Choose Adobe Analytics if you’re an enterprise with complex needs and the team to support it. Otherwise, a lighter tool will be faster to value.
Adobe Analytics reviews
G2 and Gartner Peer Insights show strong enterprise adoption with positive ratings. Users praise Workspace power and note the learning curve.
What is the best marketing analytics platform right now?
My top picks right now are Google Analytics 4 for a universal baseline, Matomo for privacy and control, and Plausible for speed and simplicity. I use all three depending on the client’s stage and constraints.
GA4 is my default. I use it on most sites, and this is not sponsored. I first switched during the UA sunset scramble and stayed because BigQuery export in the free tier changed the game. The Explore workspace, plus clean event tagging in Tag Manager, gave my team answers fast. The clincher was combining GA4 with warehouse analysis to validate attribution and build custom dashboards.
From a value standpoint, GA4 scales well. Free gets you far, and BigQuery export avoids sampling for deeper work. Alternatives with similar warehouse access can get pricey. If you eventually need 360, you gain quotas and governance that rival enterprise tools you’d pay much more for elsewhere.
Matomo is a close second for teams that need data residency and ownership. It’s consistent, feature-complete for marketing analytics, and flexible with self-hosting. Recent consent and cookieless improvements make it a strong long-term bet for regulated industries.
What I like most about Matomo is the blend of classic reports with privacy-first control. If I were running an EU-only brand with strict policies, I’d likely choose Matomo as my primary tool.
Plausible is my third recommendation, especially for smaller teams and content sites. It has a low barrier to entry, clear pricing, and a dashboard that encourages daily use. The free trial and friendly setup help folks get value in an hour, not weeks.
In practice, I mix tools. GA4 for baseline metrics and ad tie-ins; Matomo for clients who need control; Plausible for quick, no-fuss readouts; Hotjar for behavior insights when we’re running CRO sprints.
Choosing between GA4 and Matomo is genuinely tough. I stay with GA4 for most projects because of the BigQuery pipeline and ad integrations. When privacy control is non-negotiable, Matomo wins.
Hope this helped you narrow things down. If you want to go deeper on SEO and AI Visibility, I share my latest findings at aaronsnewsletter.com, and you can grab my free AI Visibility Chrome Extension. Happy measuring.
Frequently Asked Questions
Q: Which analytics tool should I start with on a tight budget?
I’d start with GA4 because it’s free and widely supported. Pair it with Hotjar’s free tier for qualitative insight. If you want simple, privacy-first numbers, try Plausible’s trial.
Q: How do I handle analytics with strict GDPR requirements?
I use Matomo when data residency and consent are critical. Configure consent first, consider cookieless modes, and keep event scopes minimal. Document everything for audits.
Q: Do I need both GA4 and a privacy-first tool?
Sometimes. I keep GA4 for ad ties and warehousing, and run Plausible or Matomo in parallel for privacy-focused reporting. It’s helpful during migrations or policy changes.
Q: How accurate are attribution reports across these platforms?
Attribution will differ by model, filters, and consent. I treat platform numbers as directional, then validate in BigQuery or the CRM. Pick one source as your north star and educate the team.