Anyone who works in a digital marketing agency will know that, aside from getting our clients to the top, one of the most fundamental aspects of our job is educating them.
Most of us have probably heard this statement when onboarding a new client: “I want to be at the top of Google by the end of the first quarter!”
While you and I know this is a completely unrealistic expectation, you can’t blame clients for thinking it’s possible. After all, they’re investing a chunky proportion of their budget in your agency to improve their online performance, and rankings are the only measure of success, right?
Not necessarily. Helping your clients learn the finer points of the industry is also key.
So, if you’re on the receiving end of that relationship and aren’t sure how to effectively measure the return on investment, or if you’re a marketing manager looking to strengthen the case for the efficacy of your work, this article is here to help.
Let’s examine the variety of tools and digital marketing metrics that can provide insight on the performance of your campaigns.
1. Google Analytics
Every modern day marketer uses Google Analytics these days. It’s our bread and butter when it comes to reviewing performance.
But aside from being good at showing how much traffic we’re getting and where it’s coming from, it’s got a whole host of other fancy, but often sidelined, tricks up its sleeve that are great at measuring the success of a digital marketing strategy.
A. What reach are you reaching?
Chances are, as soon as you log into your Google Analytics account to see how your strategy is performing, the first place you head to is Acquisition > Campaigns > Organic Keywords, to look at the Sessions column.
And you’re not wrong to do so; as your digital marketing strategy begins to pick up pace, this is one of the key areas that will indicate how well it’s actually doing. But you should be paying very close attention to the third column, New Users, too. If this metric is increasing, then the power of your digital strategy can’t be denied.
Ultimately, an increase in New Users means more people are finding and landing on the site through organic search as a result of stronger ranking positions and effective, organic marketing activity.
B. It’s about quantity and quality.
When it comes to organic traffic, remember that quality is just as important as quantity when measuring how well your digital strategy is doing. After all, while you may have experienced an influx of visitors in the aftermath of a particular campaign, what good are these visitors if they’re not engaging with the site and, ultimately, converting?
The answer to this important question lies right in front of you in the Organic Keywords section under “Behavior”:
A drop in bounce rate and an increase in pages per session and average session duration indicate that as visitors are spending more time on the site, they are engaging better with the content that’s there. This suggests that they are finding exactly what they set out looking for. And if they find what they’re looking for, they are more likely to convert.
What’s even better, if the proportion of new users has increased alongside these attributes, then you’ve got a winner. Not only is your site receiving an influx of new visitors through better rankings, but the content that’s attracting them is satisfying them in the right way, as is what you are offering.
C. Compare channels & attribution.
As we’re focusing on the remit of digital marketing, it’s natural to ignore how the other channels are performing and – even more importantly – compare how they are doing against the organic channel. This comparison could be the perfect tool for strengthening the case of your digital marketing strategy even further, as the example below highlights:
If organic search is the only channel to have experienced an improvement over the time period that you’re reporting on, then be sure to make a clear point that this marketing strategy is over-performing above all others.
What’s equally as important to consider when assessing which channel is driving the most traffic/conversions is the source (i.e. attribution) of it.
Let’s think about the typical user journey. Say, for example, you’re on the hunt for a new car – a Mini Cooper, to be precise. You type in that search term and your location into Google and are given a full list of sites you can browse to find one.
After spending some time looking around, it’s unlikely you’re going to buy a car on your first search, so you shut your browser down and stew over it for a few days. A week later, you find you can’t stop thinking about that candy red Mini Cooper, which was a great value for the money and mileage, but what was the website it was listed on again?
After some digging around in your brain, you remember the URL and punch that straight into the search bar. You then decide to take the plunge and buy the car before it’s too late.
If you’re the marketing manager of that car site, then that particular visit and lead will be registered as coming ‘direct’. But if you’re the digital marketing/SEO agency hired by that car site, it looks as though that lead has been “stolen” from you by the direct channel.
This is because the consumer’s first engagement with the website resulted from a search query on Google. If all of the work you’ve been doing has led to higher rankings in Google, then this is what enticed the user to the site in the first place. But you may not get recognized for this, simply because the actual conversion came through as direct.
There is a way, however, to look into this in more detail; and it lives here in Google Analytics: Conversions > Attribution > Model Comparison.
Here, you can get insight into how users have interacted with your site through a variety of different models.
According to Google Analytics, “An attribution model is the rule or set of rules that determines how credit for sales and conversions is assigned to touchpoints in conversion paths. For example, the Last Interaction model in Google Analytics assigns 100% credit to the final touchpoints (i.e. clicks) that immediately precede sales or conversions. In contrast, the First Interaction model assigns 100% credit to touchpoints that initiate conversion paths.”
Take a good look at this section to ensure you’re capturing how users actually converted so you don’t miss out on any well-earned recognition.
D. Who’s referring your referrals?
Since it isn’t specifically classed as an organic-led metric, we tend to shy away from reporting on referral traffic.
But just like the information regarding which channel is performing the most successfully, we can often see results of our work in this area – particularly when it comes to larger content creation and distribution activities.
While such activities are conducted to build link equity into the domain, positive results in the Referrals section of Google Analytics means your work is having a secondary an effect by driving traffic to the site.
Keep an eye out to see if any social or content amplification activities show up in this area, too.
E. How many people are landing on your landing pages?
Say, for example, you’ve built a great content piece linking into a particular page of your website – how do you measure the effectiveness of it?
Also in the Organic Keywords section of Google Analytics, clicking on the Primary Dimension “Landing Page” may provide insight.
If the internal page in question shows up in your top ten (or even top five) organic landing pages and has experienced a prominent increase, then it’s likely this can attributed to the success of your stellar content piece.
F. How good is your indexation?
The first thing any digital marketing agency should do before embarking on any off-page work is to look at the site and make sure it’s fit for purpose. Without that, your site isn’t going to be able to capture the full opportunity that the marketing strategy was designed to create.
So, when you’re assessing the performance of any strategy, you must examine indexation data by looking at URLs receiving traffic. You’ll find this information in Campaigns > Organic Keywords and by clicking on the “Primary Dimension” attribute, “Landing Page”. The number of URLs your site is receiving is the number in the bottom right-hand corner. For example, it may say “1-10 of 825”.
Quite simply, the higher this number (and if it increases by comparison week-on-week, month-on-month or year-on-year), the more long tail is working and equity is passing down through the domain.
What’s more, if this number increases, but the number of Search Queries for the same time period in Google Webmaster Tools decreases, then you know the strategy is working even better.
2. Google Webmaster Tools
In the aftermath of Google lumping all keyword data into ‘not provided’, Webmaster Tools has become a vital tool in determining the success of a digital marketing strategy thanks to its Search Queries and Links to Your Site sections.
Search Queries information can help you understand what keywords visitors have used to find and come to your site. If a particular term is experiencing a growth in impressions, as well as clicks, then you know the strategy is working to a tee.
Furthermore, similar to the way referral traffic information can be used to see how people are finding and landing on your site, Webmaster Tools’ “Links to Your Site” is a great way of seeing how well your content is being received by other sites, or how your distribution strategy is working. Keep an eye out for bigger, well-known or influential sites linking to you. Reciprocate and build goodwill to strengthen these ties.
3. Search Visibility & Keyword Rankings
Search visibility and keyword rankings can be very useful, but you are cautioned to use them carefully.
A. Search Visibility
When it comes to SEO and digital marketing, it’s imperative that you educate your clients to look at the bigger picture, and SearchMetrics is a tool that can help you do that. You know this already, but you may need to remind your clients that the performance of a single keyword should never be used as a single measure of performance.
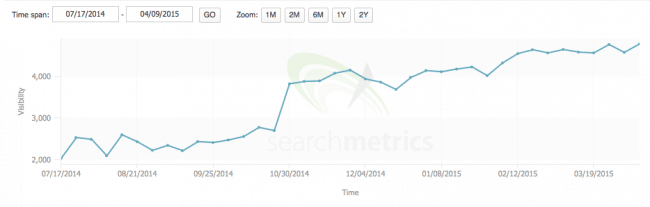
Search visibility monitors the overall search performance of your website by looking at the organic performance index (OPI). The elements of OPI focus on search volumes for key terms, how often and in which position a domain/web site appears, whether keywords are navigational or informational and the value of traffic distribution.
If your search visibility is on an upward trend, then it’s likely that your rankings, on the whole, are performing positively too.
So, if you or your client is worried about one single term dropping a few places, then use search visibility to highlight and open up the bigger picture.
 However, while it can be a very useful way of measuring performance, it must be used with caution, too. In some cases, the results can be misleading.
Say you or your client experiences a drop in the search visibility score; panic immediately sets in. But instead of losing your cool, head to the section underneath the search visibility trend graph and click on “More SEO Data.”
Once you’ve done this, you’ll be greeted by a page of your rankings and their positions, CPC, search volume and traffic index.
Below that table, you’ll see this:
In the “Losers” section, you’ll find data on the keywords that have actually contributed to the loss in search visibility. And it’s because of this section that you need to be careful when reporting on search visibility.
You may find that some of your secondary keywords are in this list and that they have driven most of this drop. Although secondary, they too have a significant search volume; if a few of them drop, it will still have an impact. And remember that at the end of the day, you’re always going to experience fluctuations with some terms.
But the thing to remember is that if your priority keywords aren’t in this losers list, and are instead on the winners list, then this is a fact worth highlighting. It opens up the bigger picture and confirms that, overall, the site is performing well in all of the right areas you’re working to influence.
B. Keyword Rankings
As highlighted previously, while keyword rankings used to be a reliable and worthy metric to report to our clients on a regular basis, Google has thrown in a few wrenches that have hindered the effectiveness of continuing to do so.
From lumping all traffic-driving keywords into ‘not provided’ to the implementation of universal search, setting specific keyword rankings should not be the only KPI target for you or your client’s strategy.
So, as stressed in the search visibility section above, it is vital for you to look at the bigger picture by analyzing the performance of all other areas mentioned. Doing this gives a more realistic view on how your strategy is really performing.
4. Social Media
We can’t talk about measuring the success of a digital marketing campaign without mentioning social media.
A good digital marketing strategy will include shareable content, and if it’s really a success, it will do exactly that – be shared.
But what happens if you’ve created a content piece that doesn’t have the visible share counters available, such as a great infographic or feature article?
Tools such as SharedCount and ShareTally will help. Simply type in the URL of the content piece you want to track and then sort through the list of the shares it has had across all main platforms.
To recap, Google Analytics always has been (and probably always will be) our bread and butter as digital marketers. Use it to find how many new visitors you’re getting, as well as to evaluate the quality of those new visitors. Compare the performance of all channels (organic, paid, direct, email, social) and monitor the sources of referral traffic.
But, as the adage goes, don’t put all your eggs in one basket. Google Webmaster Tools are an essential compliment to their analytics solutions and you can’t completely throw search visibility metrics and keyword rankings out the window, either. Ice the cake with social media share counts (vanity metrics, sure, but still good to know) and you’ve got a well-rounded, big-picture view of what’s going on.