With banner ads set to turn 20 years old next year, brands are still pouring billions of dollars into them. It’s long been known that banner blindness is pervasive, click-through rates are very poor and click-fraud is expensive. Heat map results show that eyeballs stick to where the action is – the “story” itself. Other alarming facts about banner ads include:
- Over 5.3 trillion display ads were served to U.S. users last year. (ComScore)
- That’s 1 trillion more than 2009. (ComScore)
- The typical Internet user is served 1,707 banner ads per month. (ComScore)
- Click-through rates are .1 percent. (DoubleClick)
- The 468 x 60 banner has a .04 percent click rate. (DoubleClick)
- An estimated 31 percent of ad impressions can’t be viewed by users. (ComScore)
- The display advertising Lumascape has 318 logos. (Luma Partners)
- Eight percent of Internet users account for 85 percent of clicks. (ComScore)
- Up to 50 percent of clicks on mobile banner ads are accidental. (GoldSpot Media)
- Mobile CPMs are 75 cents. (Kleiner Perkins)
- You’re more likely to survive a plane crash than click a banner ad. (Solve Media)
- Fifteen percent of people trust banner ads completely or somewhat, compared to 29 percent for TV ads. (eMarketer)
- 34 percent don’t trust banner ads at all or much, compared to 26 percent for magazine ads. (eMarketer)
- 25-34-year olds see 2,094 banner ads per month. (ComScore)
- 445 different advertisers delivered more than a billion banner ads in 2012. (ComScore)
This roundup of banner ad statistics was first reported by Digiday.

The good news is that another paid media solution combats banner blindness. It’s called native advertising and it has many flavors. Sponsored articles (also known as advertorials), sponsored recommendations (networks like Outbrain and Taboola) and sponsored social updates are all part of the native advertising ecosystem.
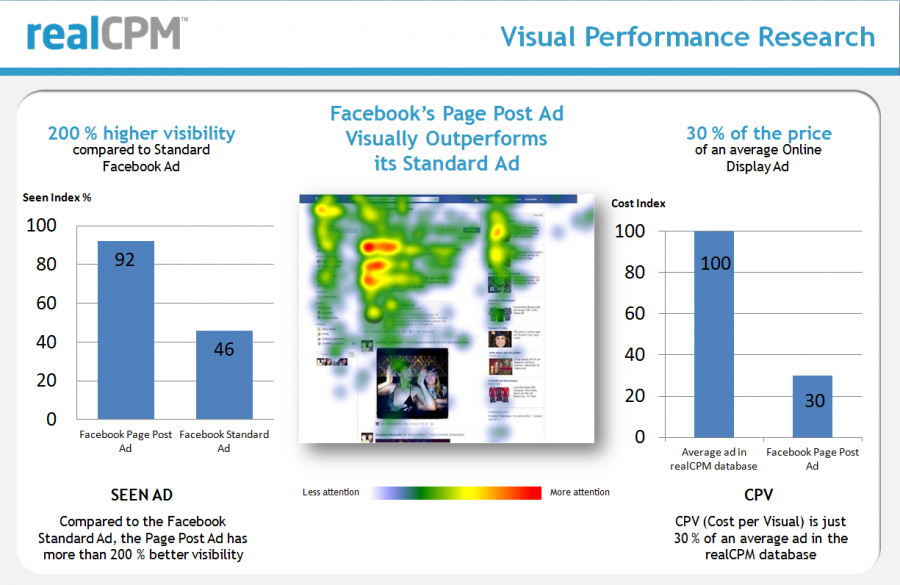
The example below shows the dramatic impact of moving from standard ads on Facebook to more native, page post ads. It increases visibility by 200 percent for only 30 percent of the standard ad price. Eye tracking studies like this show that the action is indeed in the stories and newsfeeds themselves.
Even though banner ads continue to drive lackluster returns, companies are poised to spend just under $138 billion on digital ads in 2014. This will make up around one-quarter of total media ad spending worldwide. The year-over-year growth of this spending has been declining for years and is projected to continue to decline for the foreseeable future, according to eMarketer.
Since more and more marketers are beginning to realize greater returns with their native ad experiments, its growth as a channel continues. eMarketer projects that by 2017, native spending to hit $5 billion in the U.S. alone. And that doesn’t include sponsored recommendation networks like Outbrain.
Last year, companies in the U.S. spent at least 15.2 percent of their content marketing budget on native advertising. The growth of content marketing and its adoption by brands will undoubtedly drive demand for simple content promotion and distribution channels. The native examples outlined above will likely be the paid channels rewarded the greatest because increased visibility for one sixth the cost versus banner ads is a no-brainer.
For help getting content promotion off the ground, download the Content Promotion and Distribution Cheat Sheet.